# Dashboard widgets and visualizations
After the experiment is over, you can check **dashboard widgets and visualizations** to track the performance of your model in detail. To do so:
1. Open Model Playground;
2. Click the split you want to review.
Below are some common dashboard widgets that are available irrespective of the type of problem.
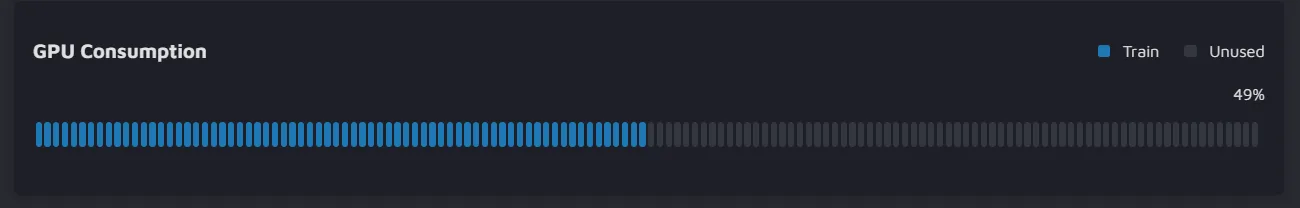
### **GPU Consumption**
With this widget, you can check how much memory is used by the GPU during training.
* If you see on the chart that the memory is not fully exploited, you still might increase the batch size, image resolution, or the number of parameters in the model architecture.
* However, if you try doing so when the consumption is almost full, the GPU will run out of memory.
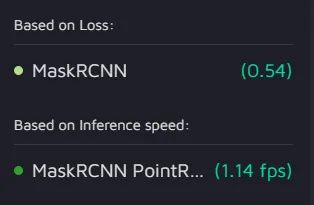
### **Best performing model**
This widget shows the most successful model from the past experiments based on different criteria.
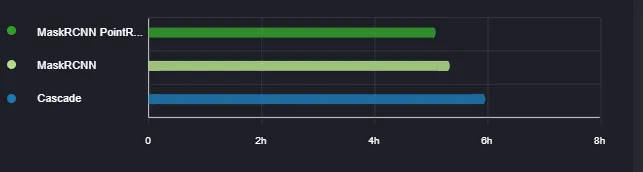
### **Runtime**
The widget allows you to observe and compare the training time for models from different experiments.
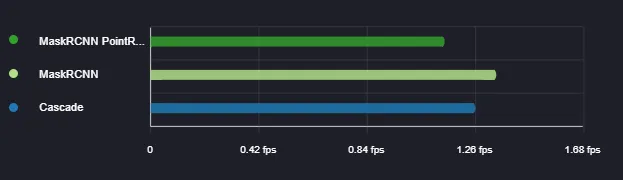
### **Inference speed**
Here you can see the speed with which the models from different experiments make predictions on new data. The inference speed is measured in fps (frames-per-seconds).
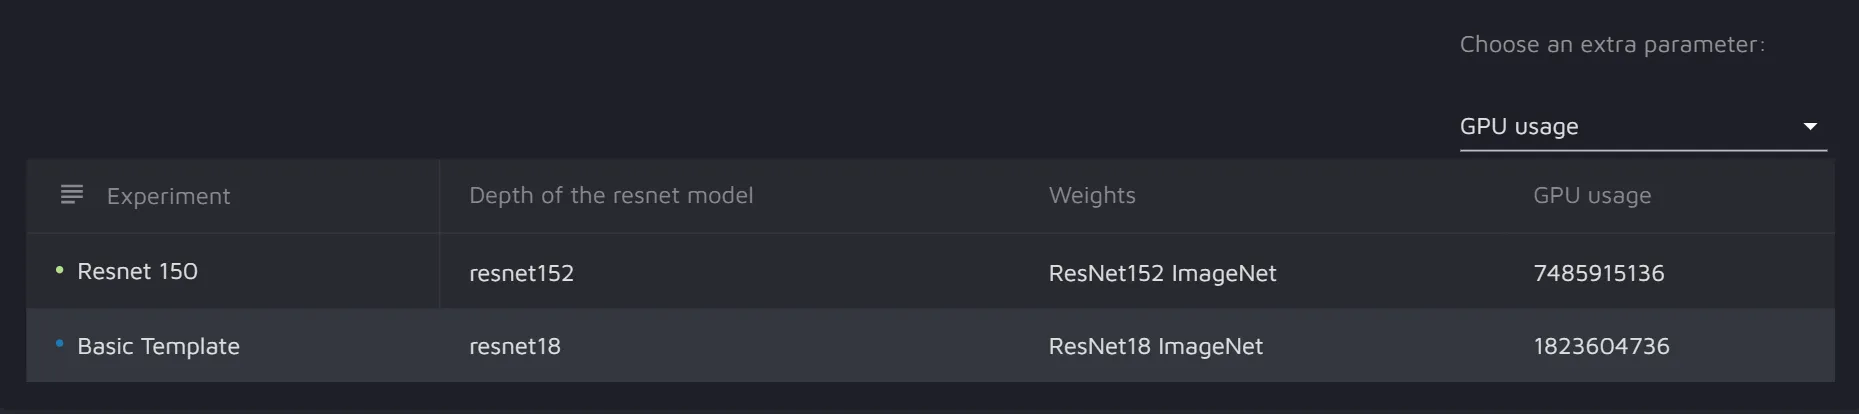
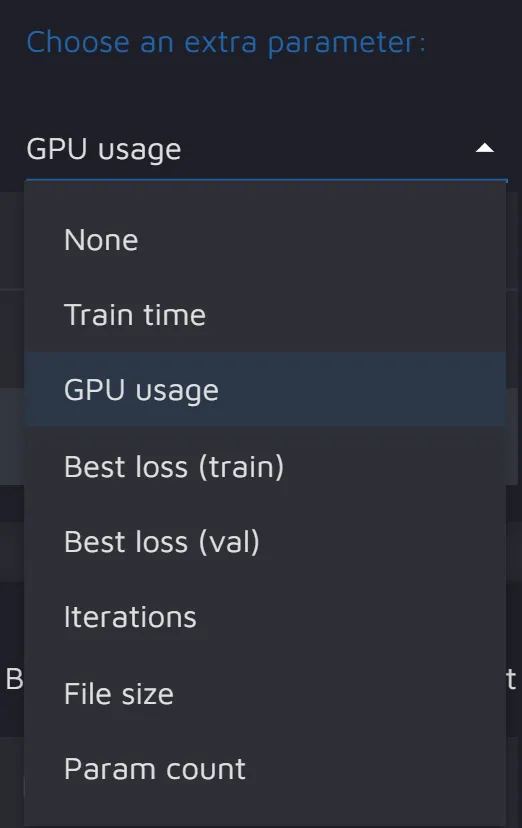
### **Hyperparameter Comparision**
With the help of this widget, you can compare the models' hyperparameters, as well as GPU usage and train time.
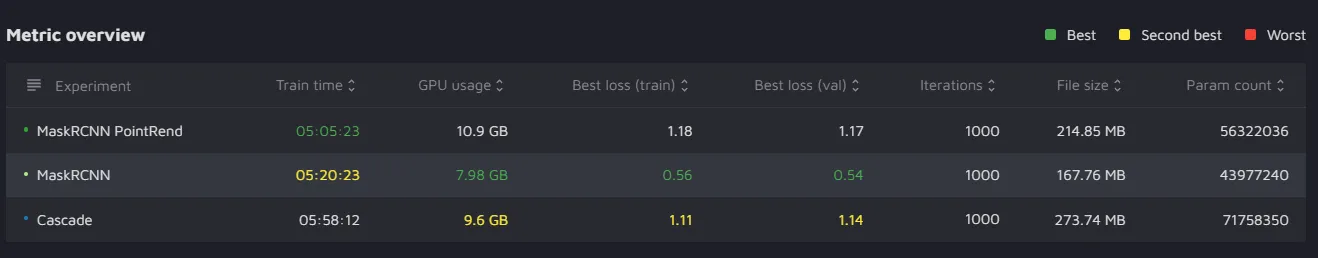
### **Metric overview**
This widget allows you to overview metrics for different models and see which one performed best, second best, or worst. Metrics for both training and validation are available for comparison.
---
# Agent Instructions: Querying This Documentation
If you need additional information that is not directly available in this page, you can query the documentation dynamically by asking a question.
Perform an HTTP GET request on the current page URL with the `ask` query parameter:
```
GET https://docs.cloudfactory.com/model-playground/dashboard-widgets-and-visualizations.md?ask=
```
The question should be specific, self-contained, and written in natural language.
The response will contain a direct answer to the question and relevant excerpts and sources from the documentation.
Use this mechanism when the answer is not explicitly present in the current page, you need clarification or additional context, or you want to retrieve related documentation sections.